GREAT BRITISH
THINK TANK |
GBTT.
WEEKLY BRIEFING
|
DATA NOT VIBES
gbtt.info |
|
|
| SUNDAY 23 AUGUST 2026 · ISSUE NO. 15 |
|
EDITOR'S NOTE
Inflation went up. Vacancies went down. Payrolls weakened. Somewhere in Threadneedle Street, Huw Pill is probably allowing himself half a smile.
The inflation headlines looked ugly this week. The detail underneath them was rather less dramatic. Strip out the energy shock and the picture is softer: core inflation barely moved, services eased and the labour market continues to cool. That is awkward for the Bank of England. The headline number makes a rate cut harder to sell; the underlying data make another rise harder to justify. Pill, who was already one of three MPC members voting for higher rates in July, may feel vindicated. The rest of the Committee has a rather less comfortable puzzle (see Cost of Living).
The public finances offered another masterclass in choosing your comparator carefully. Borrowing is above the OBR forecast. So is the current-budget deficit. Both are also better than a year ago. Ministers can therefore say the inheritance is worse than expected. Their opponents can say the numbers are improving. Both can wave an official statistic at you while carefully avoiding the other one. Welcome to fiscal politics (see The Big Story).
None of this amounts to recession. Not yet. What Britain has instead is a fairly unpleasant policy collision: headline inflation rising while the pressure underneath it softens; borrowing improving but missing plan; gilt yields still near multi-year highs; vacancies falling; and public-sector pay pulling further away from what private employers can afford.
That last one deserves more attention than it gets. The state is bidding up wages with taxpayers’ money while the private sector, which ultimately has to fund it, is slowing down. There are only so many times you can run that trick before somebody notices.
John Healey now has ten weeks until his first Budget on 28 October. He does not need another argument about whether this year looks better than last year or worse than the OBR expected. He needs to decide which of these problems government can actually fix — and, rather more importantly, which ones it is making worse.
One last thing. GBTT passed 12,500 followers on X this week. Thank you to everyone who reads, shares, argues back and occasionally tells us we have got something completely wrong. You are already way ahead of the MSM in understanding whats going on. Congratulations!
|
|
COMING THIS WEEK
The Grown-Ups Are Arriving
GBTT will announce the first cohort joining our new Academic Advisory Council this week — bringing together leading academics, economists, historians, business figures and commentators who share one fairly unfashionable belief: ideas should survive contact with evidence. The Council will challenge our work, sharpen our thinking and help make sure GBTT never becomes the sort of think tank that spends more time agreeing with itself than with reality. First names will be announced in the coming days.
|
|
THE BIG STORY
Debt Nears £3 Trillion — And Borrowing Is Still Running Above Forecast
July's public finances missed the OBR's forecast on both the headline and current-budget measures. The counterweight is real too: borrowing is £6bn lower than a year ago, and debt is falling as a share of GDP.
|
PSNB, JULY 2026
£1.8bn
£2.3bn above the OBR forecast; up £0.7bn on July 2025
|
BORROWING, FYTD
£56.7bn
Also £2.3bn above the OBR forecast; £6.0bn below same period last year
|
CURRENT BUDGET DEFICIT, FYTD
£37.5bn
£0.2bn worse than the OBR forecast
|
Public sector net borrowing was £1.8bn in July, £0.7bn more than the same month last year and £2.3bn above the OBR's own forecast, the ONS confirmed on Friday. The financial year to July, at £56.7bn, is also £2.3bn above the OBR's forecast, though £6.0bn (9.6%) lower than the same period last year. Net debt, at £2,984.9bn, is 94.1% of GDP — a share not seen since the early 1960s, though 0.8 points lower than a year ago, as growth and inflation have expanded the economy faster than debt has grown.
The current budget — day-to-day spending measured against day-to-day revenue, excluding capital investment — was also worse than planned: a deficit of £37.5bn for the financial year to July, £0.2bn above the OBR's forecast. There is no good line hiding in this release; both the broad and narrow measures missed the OBR's own numbers. Allies of Rachel Reeves have reportedly told the Financial Times that her successor, John Healey, should not "blow" a supposedly strong inheritance on further tax rises — citing the same £22bn figure Reeves once used for what she inherited, attached to no fresh calculation of their own.
Scepticism is warranted here too. A debt pile closing on £3tn and borrowing above forecast on both measures are not evidence of room to spend more.
|
|
CHART OF THE WEEK
The Pay Gap Keeps Reopening — This Is The Second Time In A Year
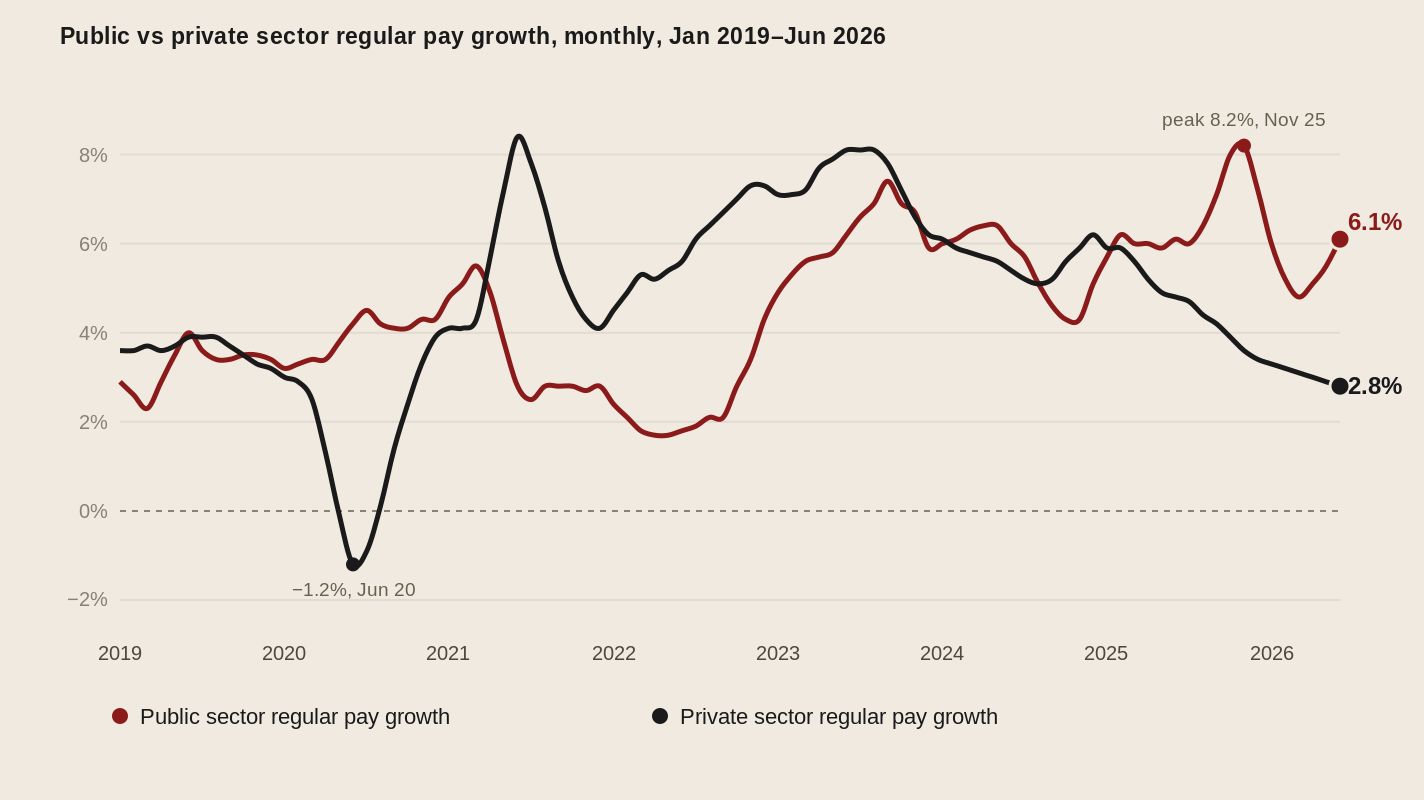
Regular pay growth, public vs private sector, monthly, 3-month year-on-year average, seasonally adjusted, January 2019–June 2026. Curves are smoothed for readability; underlying values are ONS's actual monthly readings, not interpolated. ONS's August 2026 seasonal-adjustment review reopened the back series to revision — treat pre-2026 comparisons with the usual caution. Source: ONS Average Weekly Earnings, series KAK8 (public sector, excluding financial services) and KAJ4 (private sector), released 18 August 2026.
Public sector pay has outrun private sector pay for most of the past four years, and after narrowing to 1.7 points this spring, the gap has widened again to 3.3 points — the second time in under a year it has reopened this sharply.
|
|
THE LABOUR MARKET
Vacancies At An 11-Year Low.
|
UNEMPLOYMENT
4.9%
|
VACANCIES
707,000
|
PUBLIC SECTOR PAY
+6.1%
|
PRIVATE SECTOR PAY
+2.8%
|
The ONS's labour market release, published Tuesday, covers April to June for its core survey measures. Unemployment rose to 4.9%, up 0.2 percentage points on the year, though down 0.1 points on the previous quarter. Job vacancies fell to 707,000 in the three months to July — outside the pandemic, the lowest reading since September to November 2014. A flash, provisional estimate for July payrolls shows a fall of 94,000 on the year, likely to be revised.
Public sector pay rose 6.1% this year. Private sector pay rose 2.8%. The gap is more than double.
Regular pay grew 3.5% overall, but that headline hides a much sharper divide. Public-sector pay rose 6.1% in the year to June; private-sector pay managed just 2.8%. That is more than double, and the widest gap of the past year.
The ONS is right to note that some of this reflects the timing of public-sector pay awards. Fair enough. But timing does not pay the wage bill. Right now, the state is handing its own workforce rises more than twice as large as those most private employers can afford, while those same employers are cutting vacancies and shedding staff.
And, of course, somebody has to pay for it. This week’s borrowing figures came in above forecast (see The Big Story).
A loosening labour market and rising real pay can coexist for a while. But not indefinitely.
|
|
COST OF LIVING
Inflation Jumps To 2.9% — But Core Pressure Barely Moves
|
CPI, 12-MONTH
2.9%
|
CORE CPI
2.6%
|
SERVICES CPI
3.4%
|
CPI inflation rose to 2.9% in July, from 2.6% in June. The culprit was not exactly difficult to find. Ofgem lifted the household energy price cap by 13% on 1 July, sending gas prices up 14.7% in a single month — the biggest monthly jump since October 2022.
Underneath that, the picture was much calmer. Core inflation held at 2.6%, while services inflation — the measure the Bank watches most closely for home-grown price pressure — eased from 3.6% to 3.4%.
So yes, the headline went the wrong way. But the bit the Bank should care about most actually improved.
|
|
RETAIL SALES
Sales Dip In July, But The Underlying Trend Still Points Up
|
RETAIL SALES, M/M
−0.5%
|
3-MONTH TREND
+1.1%
|
ANNUAL
+1.6%
|
Retail sales volumes fell 0.5% in July, unwinding most of June’s revised 0.7% rise. One month, though, is mostly noise. The underlying picture is rather better: volumes in the three months to July were up 1.1% on the previous three months and 1.6% higher than a year earlier — the second-strongest annual reading since April 2022.
So the consumer has not fallen over. Not yet.
The more interesting question is what happens next. With energy bills pushing CPI higher again this month (see Cost of Living), autumn will test whether that resilience can survive another squeeze on household budgets. The July dip tells us very little on its own. The next few months will tell us rather more.
|
|
HOUSING
House Prices Rise 2.0%, With London Still Falling
|
UK HPI, ANNUAL
+2.0%
|
AVERAGE PRICE
£272,000
|
LONDON, ANNUAL
−2.5%
|
The ONS/Land Registry House Price Index for June, published this week, put annual UK house-price inflation at 2.0%, with the average property now costing £272,000. London remains the outlier: prices there fell 2.5% on the year, to an average of £554,000 — still by far the most expensive region, but moving in the opposite direction to the rest of the country. We expect further falls in London property prices, especially in the prime central London sector.
|
|
MARKETS, ENERGY & GILTS
Gilts Push Higher, Oil Holds Near $94 On Hormuz Risk
|
10-YEAR GILT
5.065%
|
30-YEAR GILT
5.81%
|
BRENT CRUDE
~$93.86
|
GBP/USD
$1.3645
|
FTSE 100
10,817
|
The 30-year gilt yield ended the week at 5.81%, close to its highs for the year, while the 10-year remained above 5% at 5.065%. These are rapidly becoming the numbers that matter in Westminster.
The Financial Times reported this week that investors are already pressing John Healey over the scale of government borrowing ahead of his 28 October Budget. And they have rather more leverage than most lobbyists.
GBTT's Damian Pudner says, "It's only a matter of time before the 30y gilt breaches 6 per cent, and that should focus ministers minds."
|
|
WELFARE
Universal Credit Hits A Record 8.4 Million. Fewer Of Them Are In Work
|
UC CLAIMANTS, MAY
8.4m
|
HOUSEHOLDS
7.2m
|
IN ANY EMPLOYMENT, APRIL
37.7%
|
PAID HOUSEHOLDS WITH CHILDREN
44%
|
DWP figures published this week show 8.4 million people on Universal Credit in May, the highest since the benefit began, up from 7.7 million a year earlier — though DWP attributes 73.2% of that annual increase to the ongoing migration of claimants from legacy benefits such as ESA, not new claims. In April, the latest month broken down by employment status, the share of claimants in any employment was 37.7%, down from 41.9% a year earlier — a fall that partly reflects who is being migrated onto UC rather than people losing jobs outright. Of the 6.7 million households receiving a payment, 44% include children. The figures land the same week Damian Pudner, writing for gbtt.info, set out where he agrees and disagrees with Reform's £50bn welfare-savings claim (see Further Reading, below).
|
|
FURTHER READING
From gbtt.info This Week
£50bn From Welfare? Reform Has Got The Scale Right
DAMIAN PUDNER · WELFARE · 18 AUGUST 2026 · 5 MIN READ
Labour calls Reform's welfare plan "fantasy economics"; Mel Stride says the numbers are "simply not plausible." Pudner argues they are both wrong — he reached £22bn from sickness and disability by a different route, and Reform landed on the same figure. Where he parts company: citizenship is too blunt a test, the employer-insurance proposal could price sick workers out of hiring, and pensions cannot stay outside the discussion when 55% of social-security spending goes to pensioners.
The Leaky Cask: Rethinking Welfare
METELLUS PIUS · WELFARE · 17 AUGUST 2026 · 18 MIN READ
Aristotle warned that relief poured into a leaky cask never fills it. Britain spends £127bn a year servicing its debt, and a Universal Credit claimant working a thirtieth hour keeps 32p of it. Metellus Pius sets out what a new government could realistically fix in two years.
The City Needs A Second Big Bang
BEN RAMANAUSKAS · FINANCE · 20 AUGUST 2026 · 4 MIN READ
Jamie Dimon has warned the Chancellor against raising taxes on banks — self-interested, but not necessarily wrong. Ramanauskas traces Britain's productivity weakness to rules piled on finance since 2008 and argues the City needs a second Big Bang.
Red Tape Is A Tax On Time
DAMIAN PUDNER · REGULATION · 20 AUGUST 2026 · 5 MIN READ
The UK spends £52bn a year on compliance. Pudner, writing for CapX, asks how much of it is wasted — and argues that regulatory drag is as real a tax on growth as anything in the Budget.
|
|
NEXT WEEK
Next Week's Trouble
| 1 |
BY WED 26 AUG · TIME TBC
Ofgem: October–December Energy Price Cap
Early supplier forecasts point to a further rise on top of July's 13% jump.
|
| 2 |
THU 27 AUG · 09:30 BST
ONS: Young People Not In Education, Employment Or Training, August 2026
One of the clearest reads on how the weakening labour market is hitting 16–24-year-olds.
|
| 3 |
FRI 28 AUG · 09:30 BST
ONS: Household Costs Indices, April–June 2026
Breaks the cost-of-living squeeze down by household type and income group rather than a single CPI average — the clearest answer yet to who this week's inflation figures actually hit hardest.
|
Parliament remains in recess until Tuesday 1 September.
|
|
GBTT.
DATA NOT VIBES
Issue No. 15 · Sunday 23 August 2026 · gbtt.info
Sources: ONS (Public Sector Finances, CPI, Labour Market Overview, Retail Sales, House Price Index, all July/August 2026), HM Land Registry, OBR, S&P Global/CIPS, DWP, Bank of England, Ofgem, MarketWatch, Reuters, Financial Times, gbtt.info.
Market data: Friday 21 August 2026 — 10-year gilt 5.065%, 30-year gilt 5.81% (both MarketWatch, 5pm close); Brent crude approx. $93.86 (Reuters); GBP/USD $1.3645 (MarketWatch, late afternoon); FTSE 100 10,816.56 (confirmed close, +0.6% on the week). Prior Friday, 14 August: 10-year gilt 5.046%, FTSE 100 10,750.11. BoE base rate 3.75%, held at the 29 July MPC decision (voted 6–3 to hold; Pill, Greene and Mann voted for a rise to 4.00%). Next MPC decision: 17 September 2026.
|
|
