Issue #04
7 June 2026
Weekly Briefing |
GBTT.
Data. Not Vibes.
|
Great British
Think Tank
gbtt.info |
|
|
| Context |
Hiring expectations have turned negative again. Halifax data show a sharp regional divide, with London and the South East recording substantial real-terms declines. Construction activity fell at its fastest rate in six years, while services and the composite PMI slipped below 50. Manufacturing remained the exception. The April GDP estimate arrives on Friday and will provide the first hard test of whether the strong first quarter carried any momentum into the spring. |
|
| Issue #04 · Sunday 7 June 2026 |
| |
This week's evidence is not uniformly weak, but the balance has shifted decisively. The Bank of England's Decision Maker Panel shows expected annual employment growth continuing to decline. The series began a marked descent after late 2024. The Bank's own work finds materially weaker employment expectations among firms planning to cut jobs in response to higher employer National Insurance contributions.
Halifax reports a widening regional divide. Northern Ireland recorded annual nominal growth of 7.8%, London fell 1.5%, the South East fell 2.1%. Construction, meanwhile, contracted at its fastest pace since May 2020. Planning reform cannot by itself overcome weak demand, expensive finance and a shrinking project pipeline.
GDP for April arrives on Friday. Q1 grew by 0.6%, and some activity may have been brought forward ahead of changes in the international trade environment. April will show whether that strength carried into the second quarter. Services and the composite PMI have slipped below 50, construction is in severe contraction and hiring expectations are negative again. Manufacturing remains the conspicuous exception. That is enough to make Friday's release a serious test of the Chancellor's growth assumptions and the Bank's policy stance.
The OBR's spring forecast assumed a recovery path for growth that is looking increasingly optimistic against the run of current data. If Friday's GDP print is soft — and most forward-looking indicators now point towards weaker second-quarter growth, although manufacturing, mortgage approvals and the recovery in broad-money growth provide important counter-signals — the Autumn Budget headroom narrows further. A Chancellor who entered 2026 with almost no room for error now faces the tough choice between fiscal rules and the kind of public investment the government has staked its growth strategy on. Bond markets will draw their own conclusions.
|
|
|
Chart of the Week
House Prices: A Country Divided
Halifax HPI · May 2026 · Annual %
|
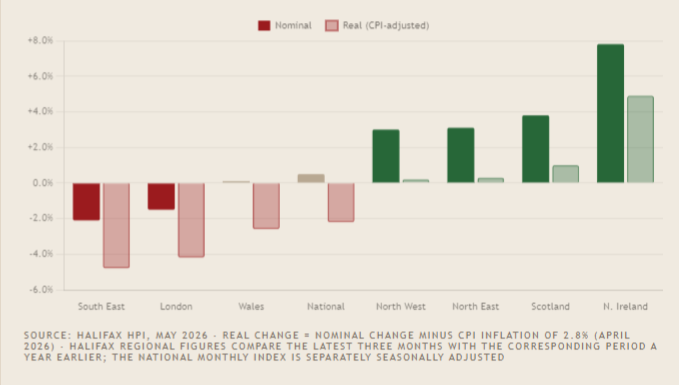
Regional annual house-price change — nominal and CPI-adjusted — May 2026
Northern Ireland +7.8% (real +5.0%) · London −1.5% (real −4.3%) · South East −2.1% (real −4.9%)
|
|
|
|
Housing & Property
Halifax House Prices
Halifax HPI · May 2026 · GBTT analysis
|
Average Price
£298,806
May 2026. −£445 versus April (£299,251).
|
|
|
Monthly Change
−0.1%
Third consecutive monthly fall.
|
|
|
Annual Change
+0.5%
Nominal. CPI-adjusted: approximately −2.2%.
|
|
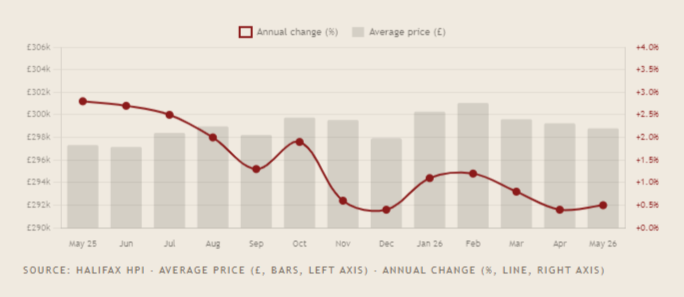
Halifax reports the average UK house price at £298,806 in May 2026, a third consecutive monthly fall of 0.1%. Average prices peaked in February 2026 at £301,051; March, April and May each recorded a decline. Annual nominal growth, at +0.5%, is barely distinguishable from zero.
The annual growth rate has fallen from 2.8% in May 2025 to 0.5% now. Adjusted precisely for CPI inflation of 2.8%, house prices are falling by about 2.3% a year in purchasing-power terms. For households already carrying higher mortgage, energy and everyday living costs, that represents a quiet but meaningful erosion on the asset side of the balance sheet.
First-time-buyer annual growth is a modest +0.3%, confirming that the entry tier remains under sustained affordability pressure. Halifax points to Middle East uncertainty, inflation expectations and mortgage rates remaining above their January levels. Premium southern markets are bearing the greatest weight: higher valuation multiples amplify rate sensitivity, and the repricing in London and the South East reflects that directly.
|
12-month price trend — May 2025 to May 2026
Average price peaked in February 2026 at £301,051 — three consecutive monthly declines followed
|
|
| |
|
Labour Market
Hiring Expectations Turn Negative Again
BoE Decision Maker Panel · May 2026 · GBTT analysis
|
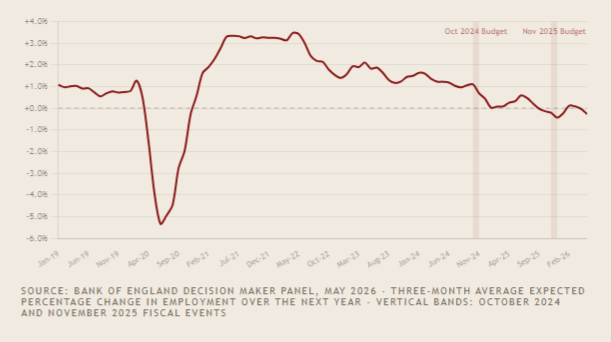
Business employment expectations weaken again
Expected Employment Growth Over the Next Year — 3-Month Average (%)
|
The Bank of England's Decision Maker Panel — a monthly survey of chief financial officers — shows expected employment growth at −0.28% in the three months to May 2026. The series began a marked descent after late 2024, first moved below zero in September 2025, briefly recovered in February and March 2026, and returned to negative territory in April and May.
The Bank's analysis indicates that firms planning to reduce employment in response to higher employer National Insurance contributions report materially weaker employment expectations, although the tax change is not the only force at work. Services firms and smaller employers remain particularly exposed to higher labour costs and weak demand. The next ONS labour-market release is Thursday 18 June, that will provide the next hard-data test of whether the survey deterioration is feeding through into payrolls, unemployment and earnings.
ONS Business Insights & Conditions Survey · May 2026
|
Staffing costs risen
66%
of businesses (10+ employees) reported higher staffing costs over the past three months
|
|
|
Would raise prices
44%
would respond to future employment-cost increases by raising prices
|
|
|
Would absorb in margins
38%
would absorb higher costs through reduced margins
|
|
|
Would cut headcount
23%
would respond by reducing employee numbers
|
|
Source: ONS Business Insights & Conditions Survey, May 2026
|
|
PMI in Brief
Services Slip; Construction in Severe Contraction
S&P Global / CIPS · May 2026 Final
|
Manufacturing
53.9
Expansion. Precautionary stock-building and front-loading amid expected price rises and supply disruption.
|
|
|
Services
49.3
Contraction. Below 50 for the first time since April 2025.
|
|
|
Composite
49.7
Marginal contraction. Private-sector activity below the no-change line.
|
|
|
Construction
38.2
Fastest contraction since May 2020. New orders fell at the sharpest rate in six years.
|
|
Above 50 = expansion; below 50 = contraction. The composite at 49.7 is marginal, but construction at 38.2 is the real story — fastest contraction since May 2020, new orders falling at their sharpest in six years. The government's housebuilding ambitions are running into a contractor base under genuine strain. Planning reform cannot fix weak demand or expensive finance.
Manufacturing at 53.9 is the exception, though much of the strength reflects precautionary stock-building rather than underlying demand. The broader picture is deteriorating.
|
|
Global Context
OECD: Britain Is Falling Behind
OECD Economic Outlook, Volume 2026 Issue 1 · 3 June 2026
|
UK GDP 2026f
0.9%
Jun 2026 forecast. Up from 0.7% in March, but sub-1% and below most peers.
|
|
|
CPI Inflation 2026f
3.7%
Above target. March interim raised to 4.0% on Middle East energy shock; June revised down marginally.
|
|
|
Unemployment 2026f
5.5%
Rising. From 4.9% in the December 2025 forecast — a significant deterioration in twelve months.
|
|
The OECD's June 2026 outlook cuts through the government's growth narrative. UK GDP at sub-1% for 2026 is weak in absolute terms and against peers — the US holds at 2.0%, even Canada recovers to 1.7%. Britain's direction is downward, not upward.
The core problem is structural. Fiscal buffers are thin, the deficit is above 4% of GDP, debt is heading through 105%, and the Chancellor's rules are under formal pressure. Add a 3.7% inflation forecast driven by energy costs, and the Bank of England faces a stagflationary squeeze — slowing growth and sticky prices simultaneously. That's not a scenario standard monetary policy handles well. Unemployment reaching 5.5% is the labour-market consequence, compounded by higher employer NICs making it more expensive to hire precisely when demand is softening.
|
|
Money & Credit
Approvals Up, Lending Soft, Money Supply Recovering
Bank of England Money & Credit · April 2026 · Released 2 June
|
House Purchase Approvals
65,945
15-month high. Up from 63,979 in March. Above Reuters consensus of 62,000.
|
|
|
Net Mortgage Lending
£4.4bn
Down from £6.2bn in March. Lowest since October 2025. Reflects completions on pre-rate-spike deals.
|
|
|
Money Supply (M4ex)
4.6%
Up from 4.5% in March. Now above the range consistent with 2% inflation (4–4.5%).
|
|
The housing market is fading from its pre-conflict peak. Completions will likely remain soft through Q2 and Q3 as the approval pipeline normalises. Consumer credit growth at 8.8% — unchanged from March — is holding up household spending, but it is borrowed resilience rather than income-driven demand. Business credit is a genuine bright spot: annual growth of 9.4%, with large firms at 12.3%. Broad money is no longer contracting. Taken together, this is an economy muddling through at low speed — neither in recession nor growing in any way that addresses the underlying productivity gap.
|
|
Markets
Gilt Markets & Sterling
Friday 5 June 2026
|
UK 10yr Gilt
4.88%
Late level, 5 Jun. Yield remains above Bank Rate.
|
|
|
UK 30yr Gilt
5.56%
Late level, 5 Jun. Elevated long end reflects term, inflation, supply and fiscal risks.
|
|
|
GBP / USD
1.335
Indicative London level at 16:00, 5 Jun.
|
|
|
GBP / EUR
1.157
Indicative London level at 16:00, 5 Jun.
|
|
|
FTSE 100
10,368
Close 5 Jun. +0.07% on the session.
|
|
Observation date: 5 June 2026 · Gilt yields: late market levels · FX: indicative London levels at 16:00 · FTSE 100: official session close · Bank Rate: 3.75% · Next MPC decision: 18 June 2026
Gilts continue to provide an uncomfortable backdrop for a government with a heavy financing requirement and thin fiscal headroom. US equities turned red into the close as strong jobs data pushed back Fed easing expectations and renewed Middle East risk added to the caution. Friday's April GDP will sharpen the domestic easing debate, but the gilt response depends on composition as much as headline.
|
|
Data Calendar
Week of 8–12 June 2026
| Monday 8 June 2026 |
MED 09:30 |
Beyond GDP Insights & UK Measures of National Well-being Dashboard Office for National Statistics A broader assessment of national progress beyond the GDP headline. |
|
| Tuesday 9 June 2026 |
MED TBC |
BRC–KPMG Retail Sales Monitor (May 2026) British Retail Consortium · Expected It will provide an early read on discretionary spending after April's sharp year-on-year decline. |
|
| Wednesday 10 June 2026 |
HIGH 09:30 |
National Balance Sheet and Capital Stocks — Preliminary Estimates 2026 Office for National Statistics Important for the investment, productivity and national-wealth debate. |
|
| Thursday 11 June 2026 |
HIGH 00:01 |
RICS UK Residential Market Survey (May 2026) Royal Institution of Chartered Surveyors The April buyer-enquiries balance was −34; the May release will test whether demand remains firmly negative. |
|
HIGH 09:30 |
Work Capability Assessment Statistics Department for Work and Pensions · Universal Credit and ESA Central to the debate over inactivity, welfare caseloads and the fiscal cost of long-term sickness. |
|
| Friday 12 June 2026 |
HIGH 07:00 |
April GDP and Output Package Office for National Statistics Monthly GDP, the Index of Services, Index of Production, construction output and UK trade are released together. |
|
|
GBTT.
Data. Not Vibes.
Issue #04 · 7 June 2026 ·
| | |